MC // Monitoring
How electrical test companies can adapt to meet customers’ evolving needs
Always-On Electrical Assets Require Continuous Monitoring
The traditional business model for electrical test companies has been to periodically run tests on their clients’ electrical assets. This would provide a certain level of comfort to customers that their equipment was in good working order and would remain that way until the next scheduled test.
That isn’t always the case though — failures can occur in between tests. Given the high impact of failures, the aging of medium-voltage assets, and the growing number of options in cost-effective monitoring solutions, a change is taking place. End users are increasingly installing 24x7 monitoring on their medium- and high-voltage assets so that potential problems are spotted when they start and are more likely to be rectified before failure occurs.
Cost-effective monitoring systems and services for thermal increase and partial discharge (PD) are now readily available. Thermal monitoring checks the health of the conductors and can take the place of periodic infrared scans while reducing the need for visual inspections. PD monitoring checks the health of the insulation and can take the place of periodic PD surveys.
Test companies that rely on infrared and PD surveying of medium- and high-voltage equipment and do not adapt to this change may suffer in the coming years. An end user who buys a 24x7 monitoring system needs less periodic testing, thereby reducing the business available to test companies. Test companies that adapt and offer to install monitoring systems and manage them by responding to alerts could see their business increase. It is important for electrical test companies to understand this paradigm shift and plan accordingly in order to ensure the continued success of their businesses.
Periodic Testing
Periodic testing is certainly better than no testing, but it isn’t perfect. All it takes is for a problem to go from undetectable to failure in less time than the period between the surveys for potentially catastrophic losses to occur. As the frequency of testing increases, the chance of failure decreases, but, at some point, that becomes too labor intensive and financially onerous to support.
The obvious analogy is the increasing use of 24x7 wearable EKG monitors for heart patients. Getting an EKG done once a year during a physical is great, but serious issues can occur between visits. For most people, the inconvenience and cost of such a device makes it not worth the benefit, but as the cost goes down and convenience goes up, who knows? For high-risk patients, it can literally be a lifesaver.
Typically, on assets above 2.5 KV, PD testing is done annually or biannually because the general belief is that PD takes at least that long to lead to failure. That is sometimes, even often, true, but it is not always the case. Take the following incidents for example.
Example 1: U.K. Distribution Utility
In November 2014, this U.K. utility installed an ultrasonic and Transient Earth Voltage (TEV) monitor at one of its high-risk substations. The site was deemed high risk due to its location near a river’s edge combined with the type of switchgear operated at the location. Tragically, there was no remote communication channel available, and the system data was not being reviewed during the testing period. On July 28, 2015, the switchgear failed catastrophically (see Figure 1).
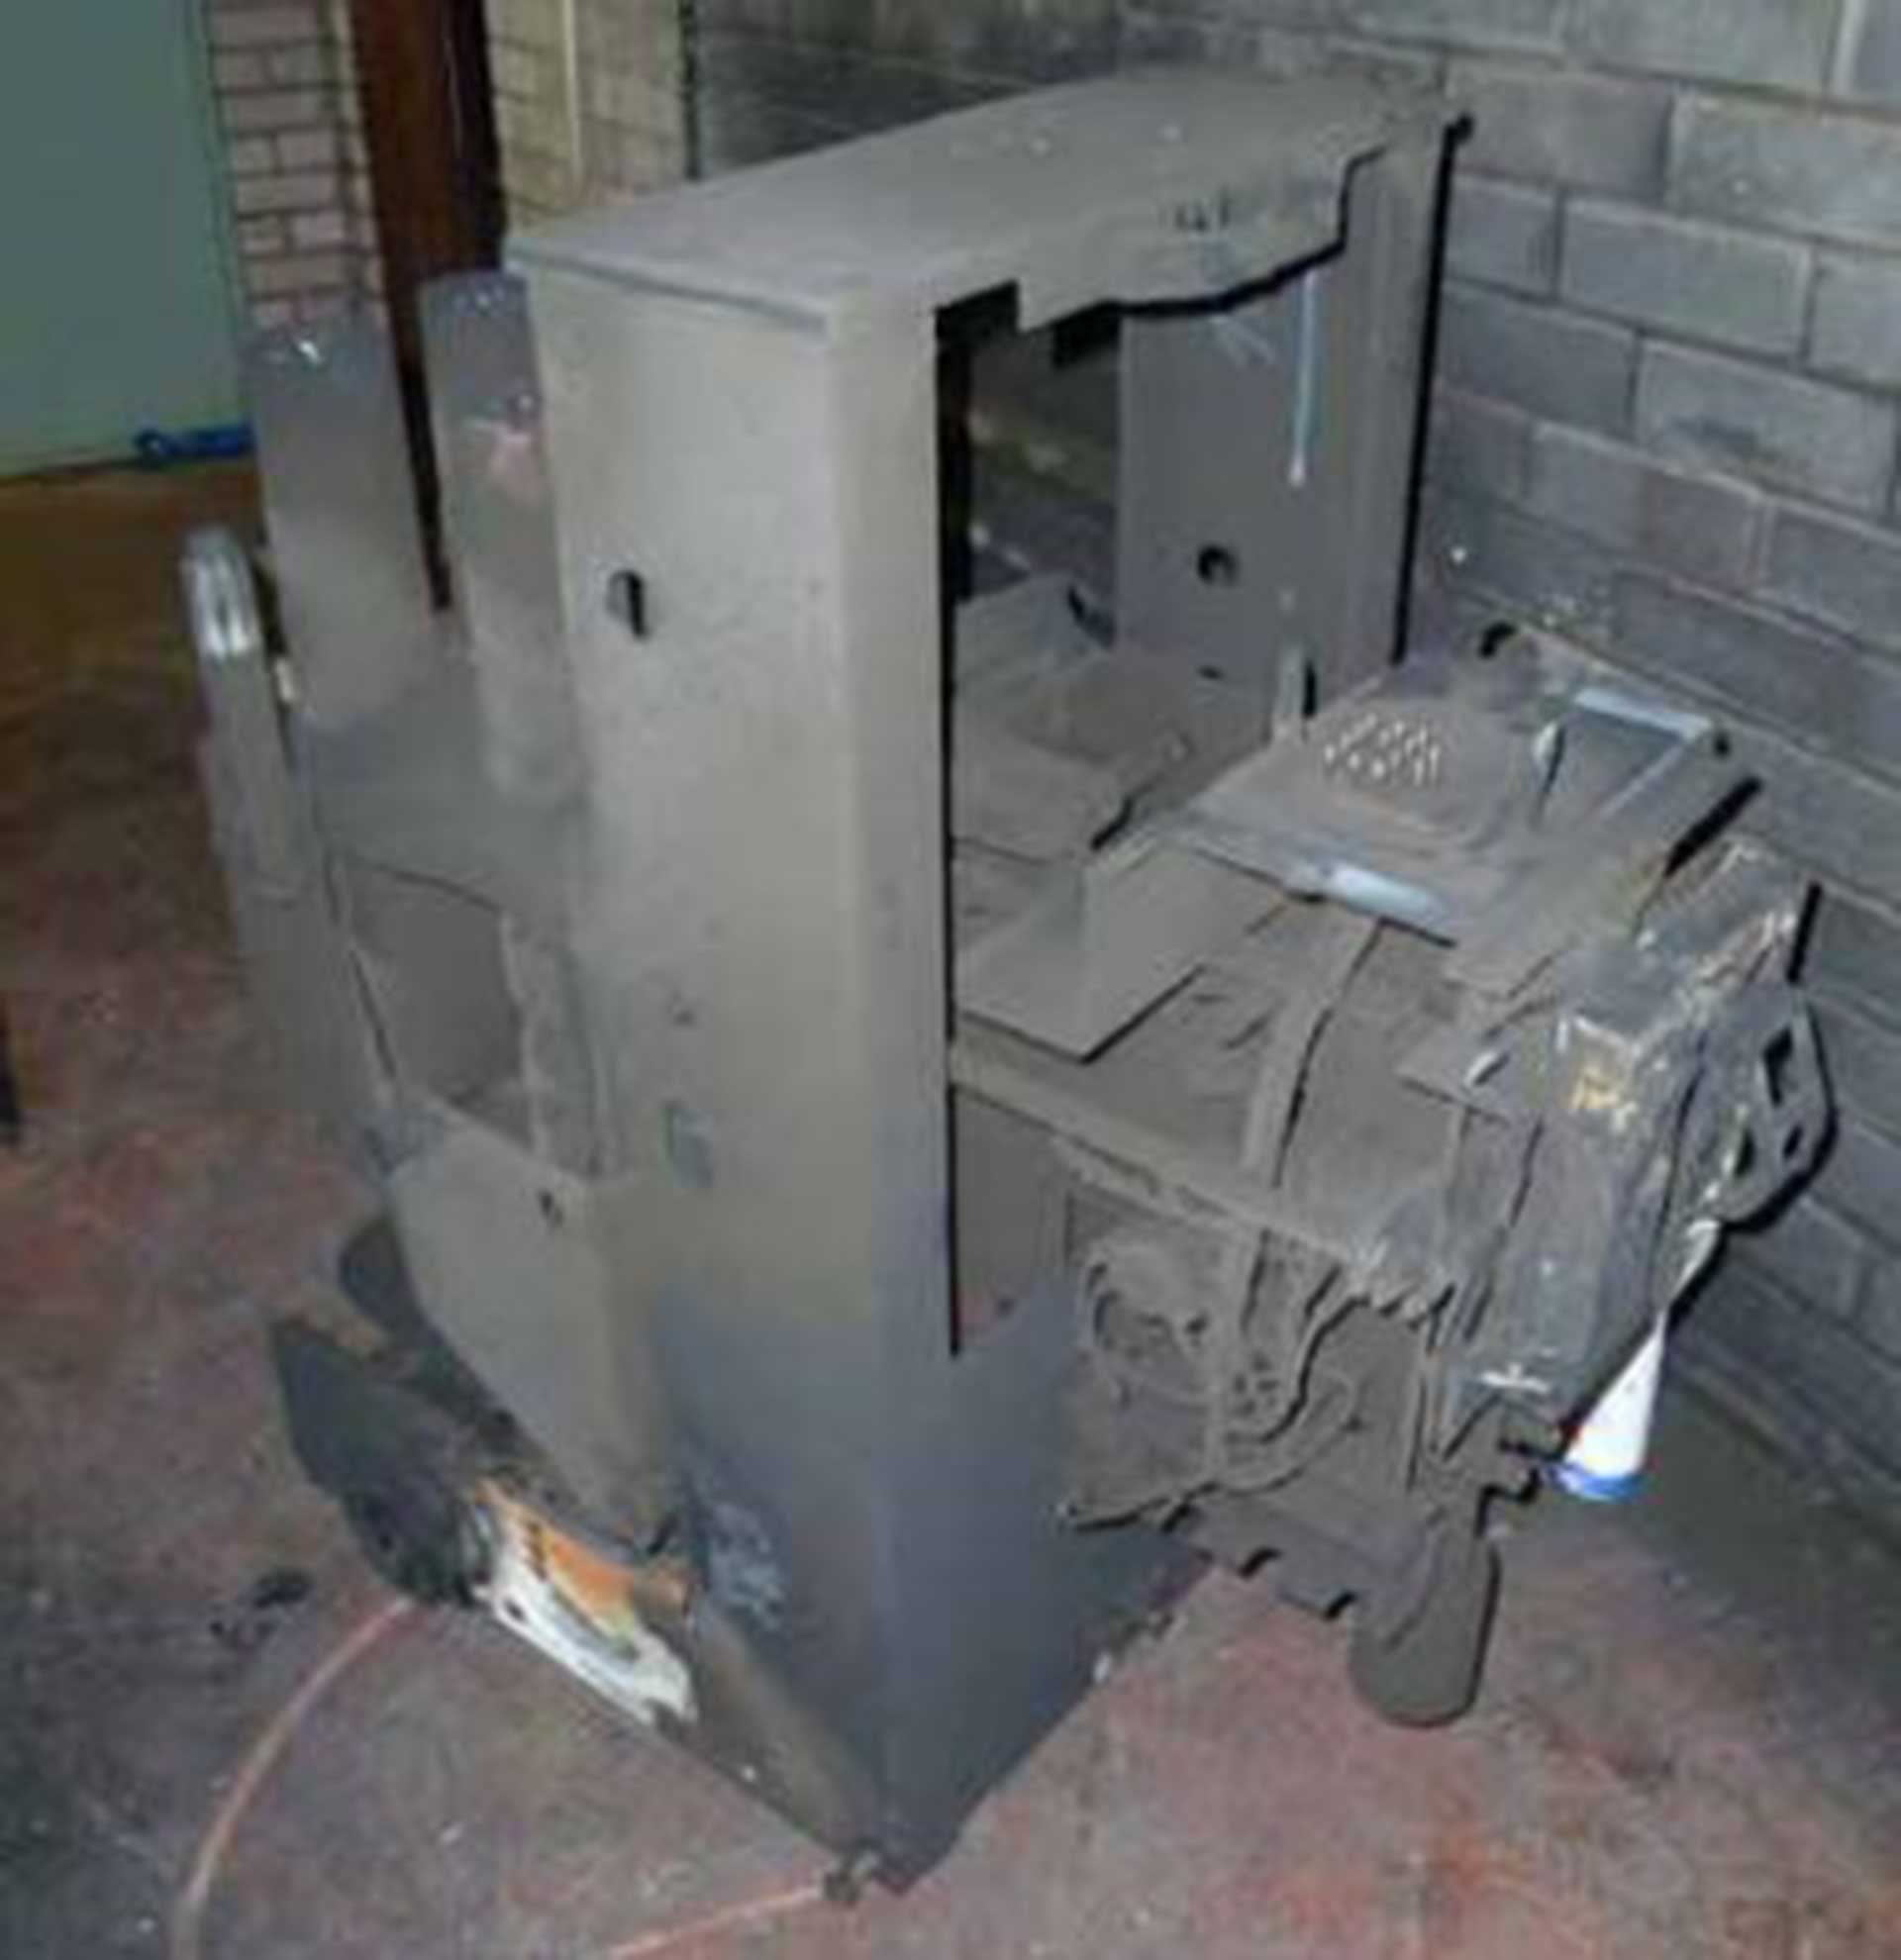
FIGURE 1: As a result of inaction, the switchgear at a U.K. utility experienced a catastrophic failure.
Experts reviewed the recorded data and found the substation had been reading little to no activity from installation in November 2014 until March 2015. From March 2015 on, however, there was a marked increase in PD activity. Over a week-long period, PD levels rose to a level that would have triggered an alarm had one been installed (see Figure 2). This spike continued to exist until the failure occurred. As a direct result of downtime, the utility received customer minutes lost (CML) and customer interruption (CI) fines totaling $700,000.
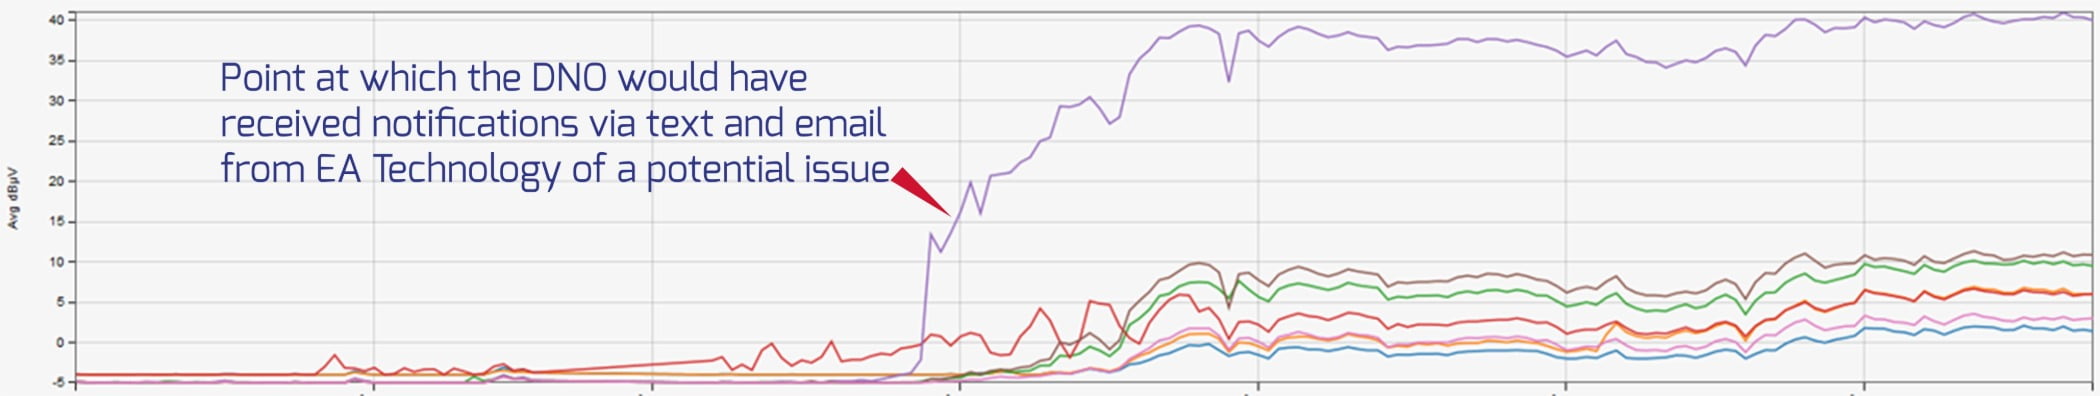
FIGURE 2: Over a weeklong period, PD levels rose to a level that would have triggered an alarm had one been installed.
A periodic survey done in early March would have found no issues, but a catastrophic failure still occurred four months later. This would have been easily caught with continuous monitoring.
Example 2: INEOS - Petro-Chemical Plant
INEOS’s largest manufacturing site is based in Grangemouth, Scotland, which is home to its Olefins and Polymers (O&P UK) business as well as a crude oil refinery that produces the bulk of Scotland’s fuel. The company’s combined heat and power (CHP) plant supplies electricity to the Grangemouth site through two separate, 1-km-long, XLPE cable circuits known as CHP1 and CHP2. After detecting PD in three relatively new joint pairs during routine conventional off-line very-low frequency (VLF) testing, the decision was made to install an online permanent cable monitoring system.
Following installation, the PD activity identified during the VLF testing was confirmed in all three cables and located to the vicinity of the suspect joint pairs. This eliminated the need to take the CHP plant offline again to perform further periodic VLF testing to determine the severity of the problem. Avoiding just a single CHP outage in this way saved more money in terms of lost production than the entire cost of the installation.
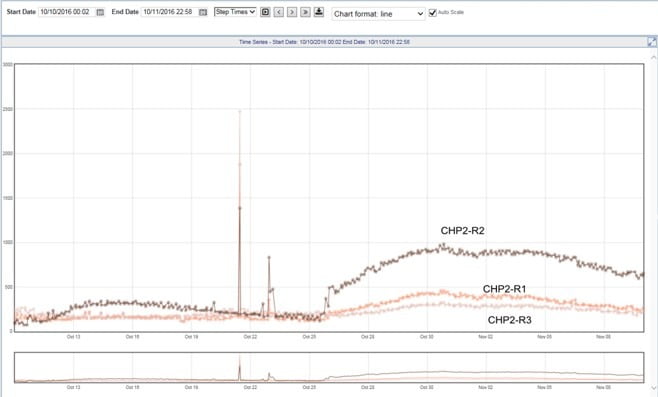
FIGURE 3: The onset of PD can be seen for cable CHP2-R2 over a one-month period, when levels rose from 100 to 1,000 pC.
The onset of PD can be seen in Figure 3 for cable CHP2-R2 over a one-month period, when levels rose from 100 to 1,000 pC. Figure 4 shows the very clean pulse that enabled the location of PD. This highlights the benefit of continuous monitoring, whereby trends in activity can be seen that would have been missed with spot measurements alone.
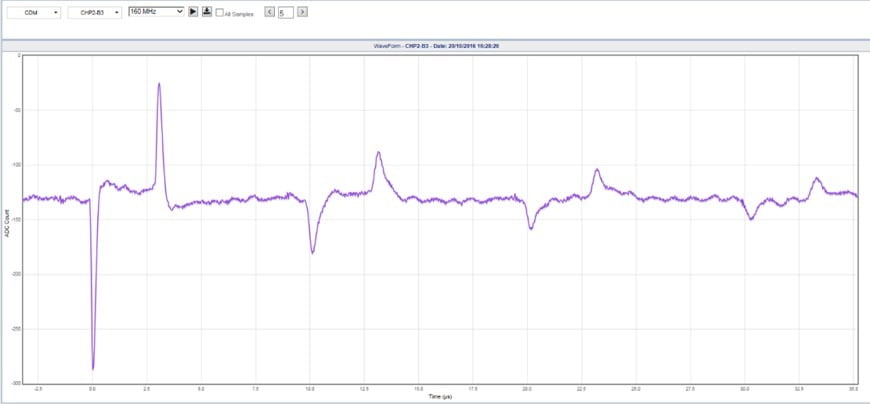
FIGURE 4: This image shows the current PD pulse recorded on CHP-R2.
All three cables where PD was identified were successfully managed until their joint-pairs were replaced during the planned outage 10 months later. The suspect joint pairs were sent for forensic examination.
During the forensic investigation, evidence of PD was found in one joint of the joint pairs when the outer heat shrink cover was removed from the cable stress control sleeve. The root cause was identified to be an incorrect gap between the XLPE insulation and the connector being only 1 mm instead of the recommended 5 mm, preventing the yellow mastic from filling the gap properly and leaving a void that led to the elevated electrical stress responsible for the detected PD.
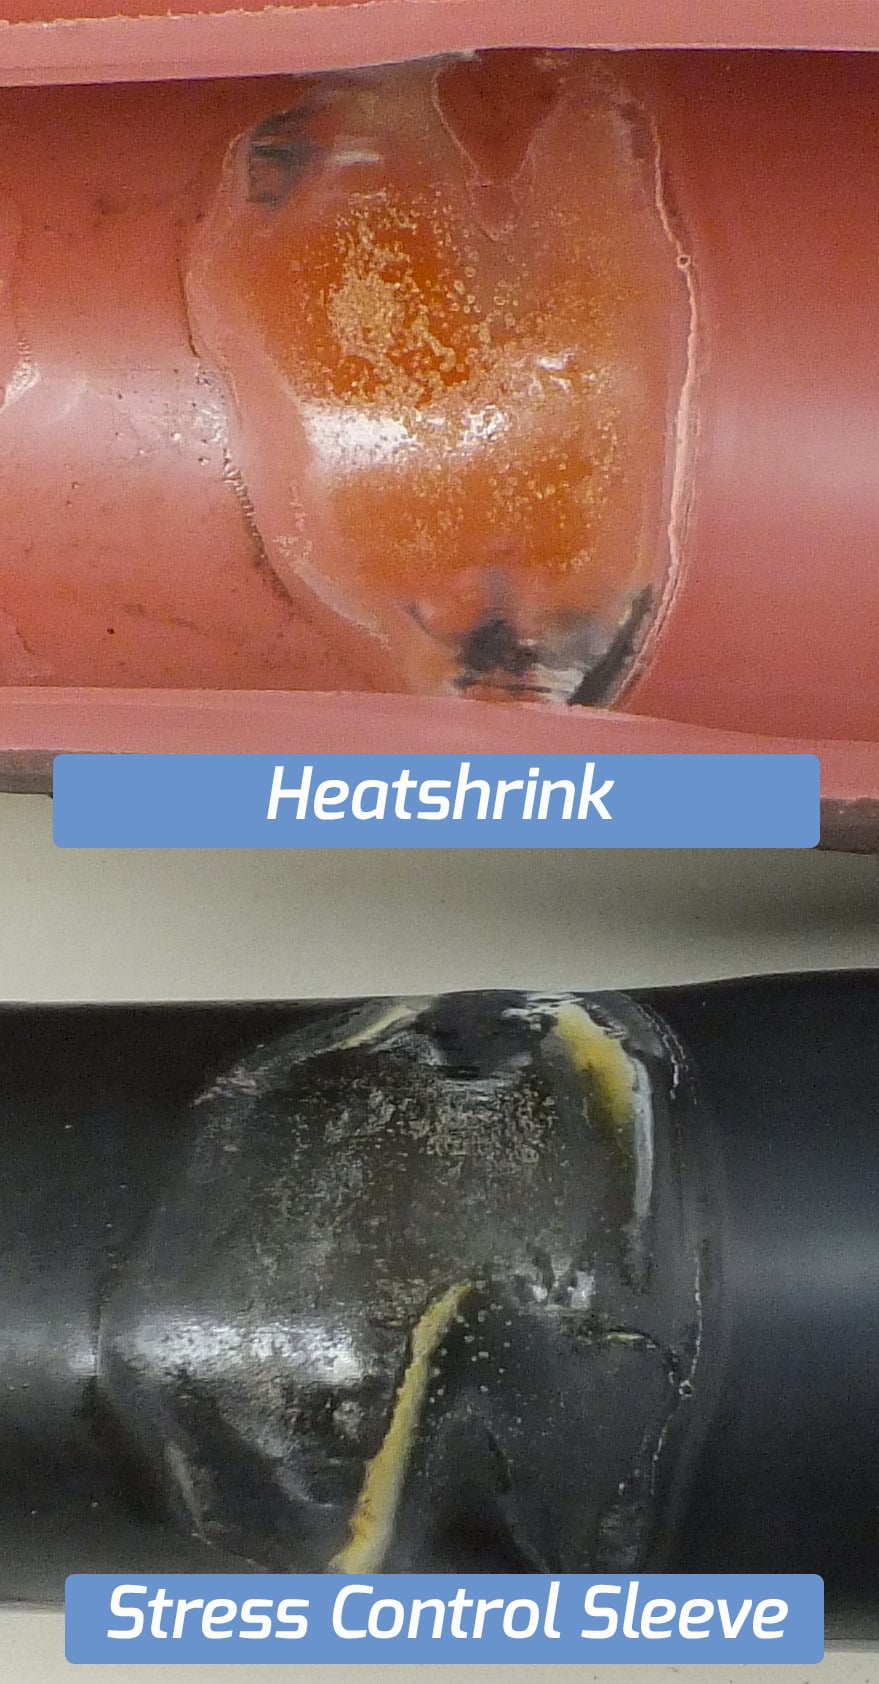
FIGURE 5: The root cause was identified to be an incorrect gap between the XLPE insulation and the connector being only 1 mm instead of the recommended 5 mm, preventing the yellow mastic from filling the gap properly and leaving a void that led to the elevated electrical stress responsible for the detected PD.
Example 3: Critical Infrastructure Building
A large office building had full-time PD monitoring installed due to the critical nature of its operations. Ultrasonic and TEV detection were provided for all cable termination compartments. An installation mistake common to all of the potential transformer cables (see Figure 6) caused partial discharge to be present almost immediately upon energizing.
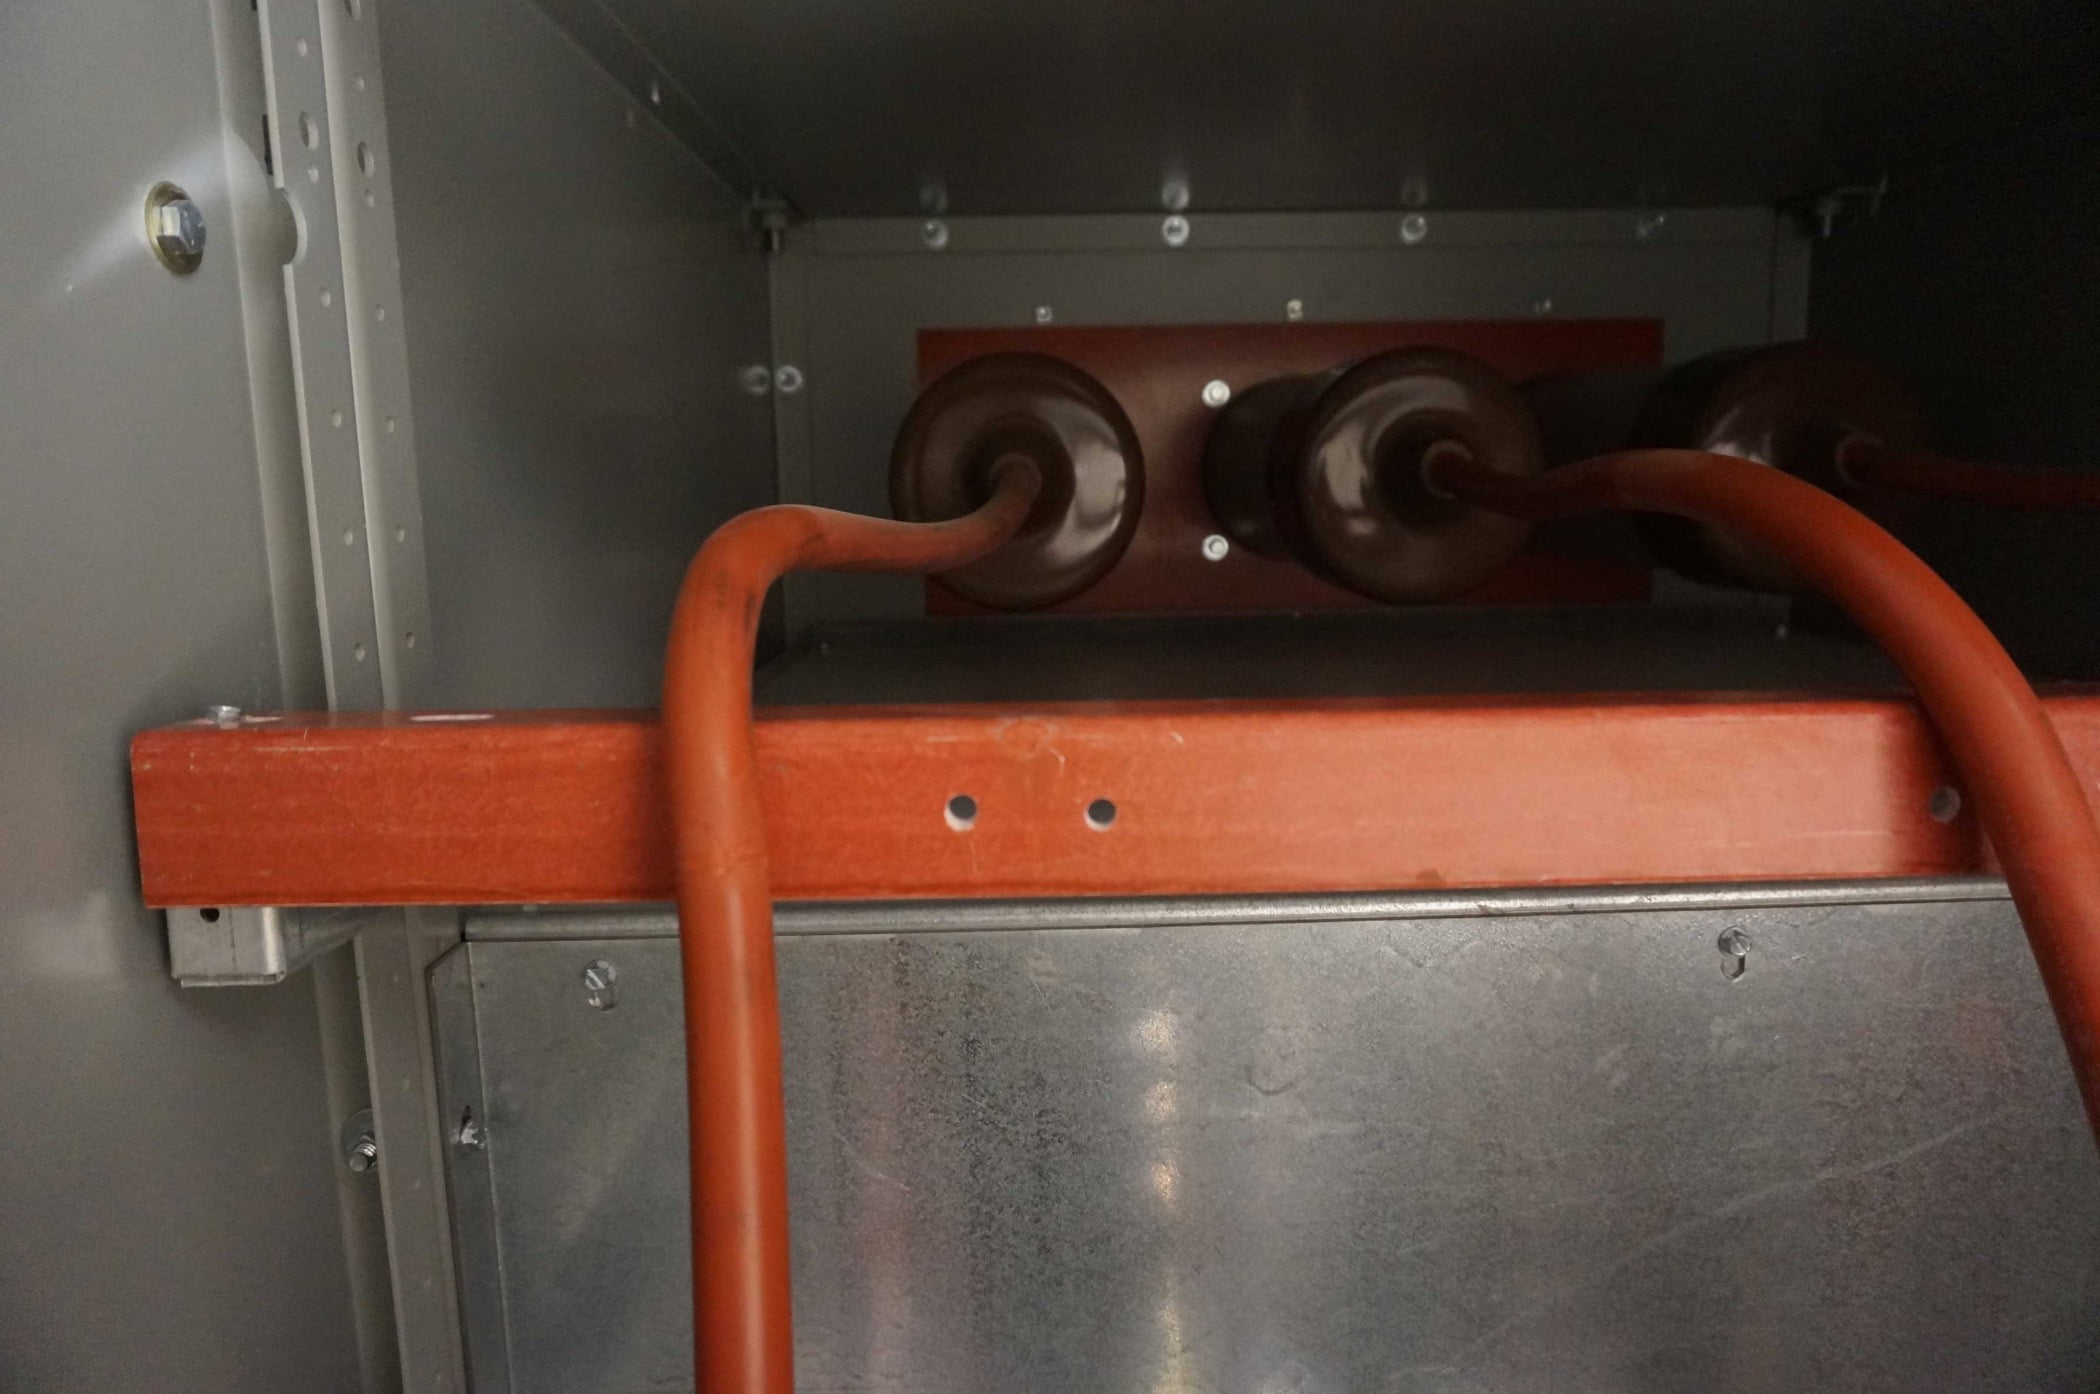
FIGURE 6: Improperly installed PT cables.
As can be seen in the graph in Figure 7, the cable was energized in March 2017, and, within a month, the ultrasonic level was already four times higher than other identical cabinets where the problem was previously corrected. Over the course of the next three months, the level increased to more than 100 times that of the good cabinets.
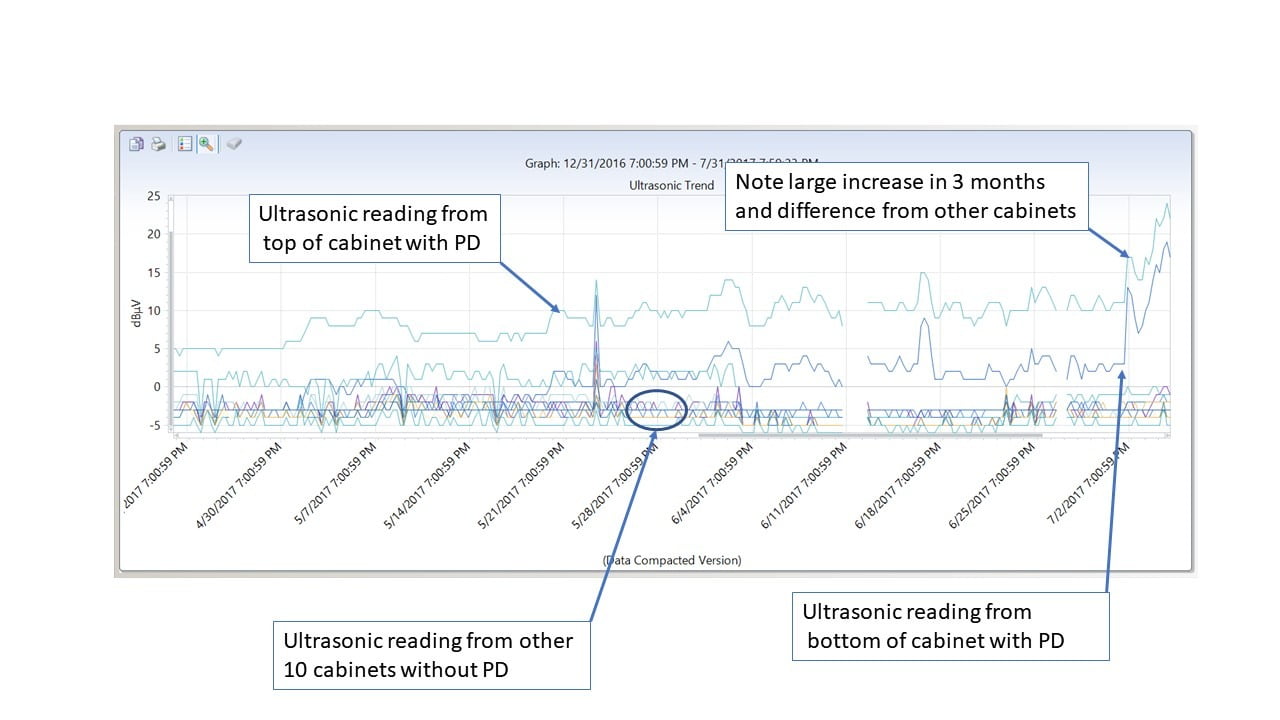
FIGURE 7: This graph shows the marked increase in PD signature.
The cable was deenergized after a few months, and the damage was similar to a previously replaced cable shown in Figure 8.
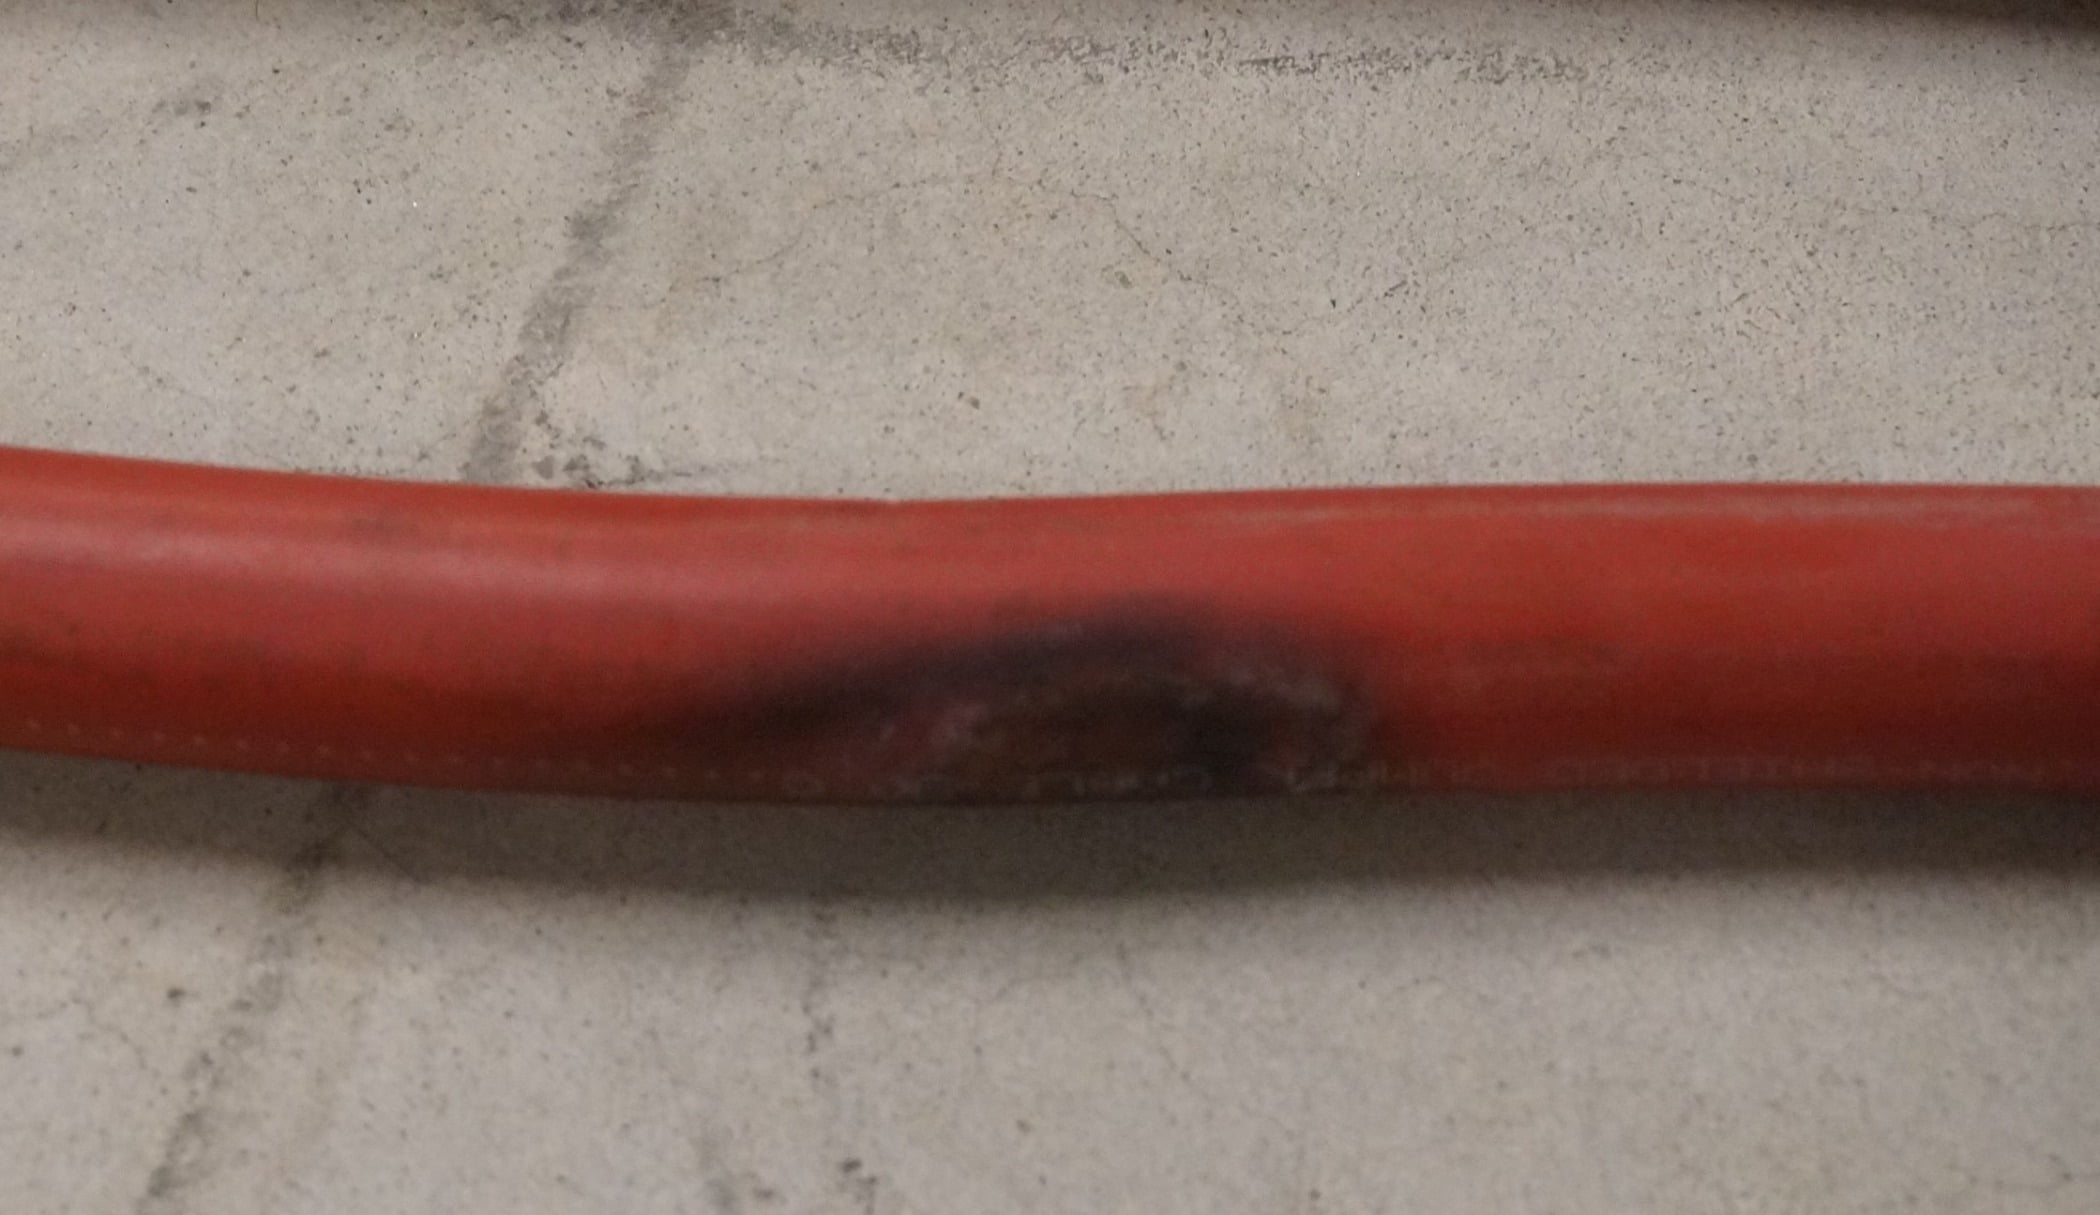
FIGURE 8: PD damage to a PT cable.
Is Periodic Surveying Dead?
Periodic testing is so powerful and inexpensive, it will take a lot to kill it. For assets below 2.5 KV, periodic testing will always be more cost-effective. It is the cheapest way to go, but when asset owners start to look seriously at the cost of outages and aging infrastructure, price shouldn’t be the only consideration. Each asset failure has an impact, and owners should do a risk and impact analysis before deciding what to do. For most applications, a mix of full-time monitoring on critical assets and periodic surveying on less critical systems will prove to be the ideal route going forward.
Full-Time Monitoring
Full-time monitoring roughly falls into one of two categories: invasive and noninvasive. The invasive systems require full shutdown and internal access to cubicles. They are typically hardwired with sensors, like coupling capacitors. These are capacitor dividers that are connected between the conductors and ground and have a test cable connection port. High-voltage wiring is required between the sensor and high-voltage conductors. Low-voltage wiring is required between the sensor port and the electronics portion. A Hipot test is required after installation and before energization. Invasive systems are almost always permanently installed at the time of the original system installation due to the work required to remove and relocate them.
Noninvasive monitor systems make use of the same technologies commonly utilized by handheld noninvasive test devices. These include ultrasonic detection and TEV. The main advantage of these systems is that they can be installed on the outside of switchgear and do not require any outages. Cable monitoring can be added to either system but does require access to the ground straps of the cables. Noninvasive monitors can be removed and relocated periodically.
Either type of system can provide local or remote access. Local access is easier to install but does not provide instant response to emerging faults. Remote access with continual monitoring provides the additional advantage of allowing experts to analyze the data, so the end customer (or the service company) does not require any PD expertise.
Going back to the wearable EKG monitor, would it make more sense for individuals to interpret the charts themselves or have the data continuously streamed to the hospital where a doctor analyzes it?
Where Do Test Companies Fit In?
As medium-voltage asset owners make the inevitable move to more continuous testing, less periodic testing will be required. Also, if issues are caught before failure, fewer large repairs will be required. Test companies that rely solely on testing and repairing failed equipment will suffer from reduced opportunities.
Back to the 24x7 wearable EKG monitors for one last reference — when they become inexpensive enough for everyone to have one, medical technicians who perform routine EKG’s in health care facilities may want to consider new careers.
Test companies may want to purchase portable monitor systems and provide the install, removal, and relocation services in addition to leasing the equipment to the asset owners. This is a viable intermediate step to permanently putting monitors on all assets.
Businesses that evolve can still find plenty of opportunities if they take the initiative to start designing, installing, and maintaining monitoring systems.
William Higinbotham
William Higinbotham is president of EA Technology LLC. His responsibilities involve general management of company activities in North and South America. He is a senior member of the Institute of Electrical and Electronics Engineers and has authored and co-authored a number if IEEE standards in the field of power system protection and communications and other industry papers. He holds one patent in this area as well. Higinbotham received his bachelor’s degree from Rutgers, The State University of New Jersey, School of Engineering in 1984.

All images courtesy of EA Technologies